Volkswirtschaft
- Daten, Kennzahlen, Prognosen
Die
Weltbevölkerung umfasste beim Jahreswechsel 2015/16 rund 7,39 Milliarden
Menschen. Die UNO rechnet für den Zeitraum 2015 bis 2020 mit einem Bevölkerungswachstum
von rund 78 Millionen Menschen pro Jahr. Die Vereinten Nationen erwarten
2050 etwa 9,7 Milliarden Menschen auf dem Globus. Für das Jahr 2100
werden 11,2 Milliarden Menschen prognostiziert.
|
|
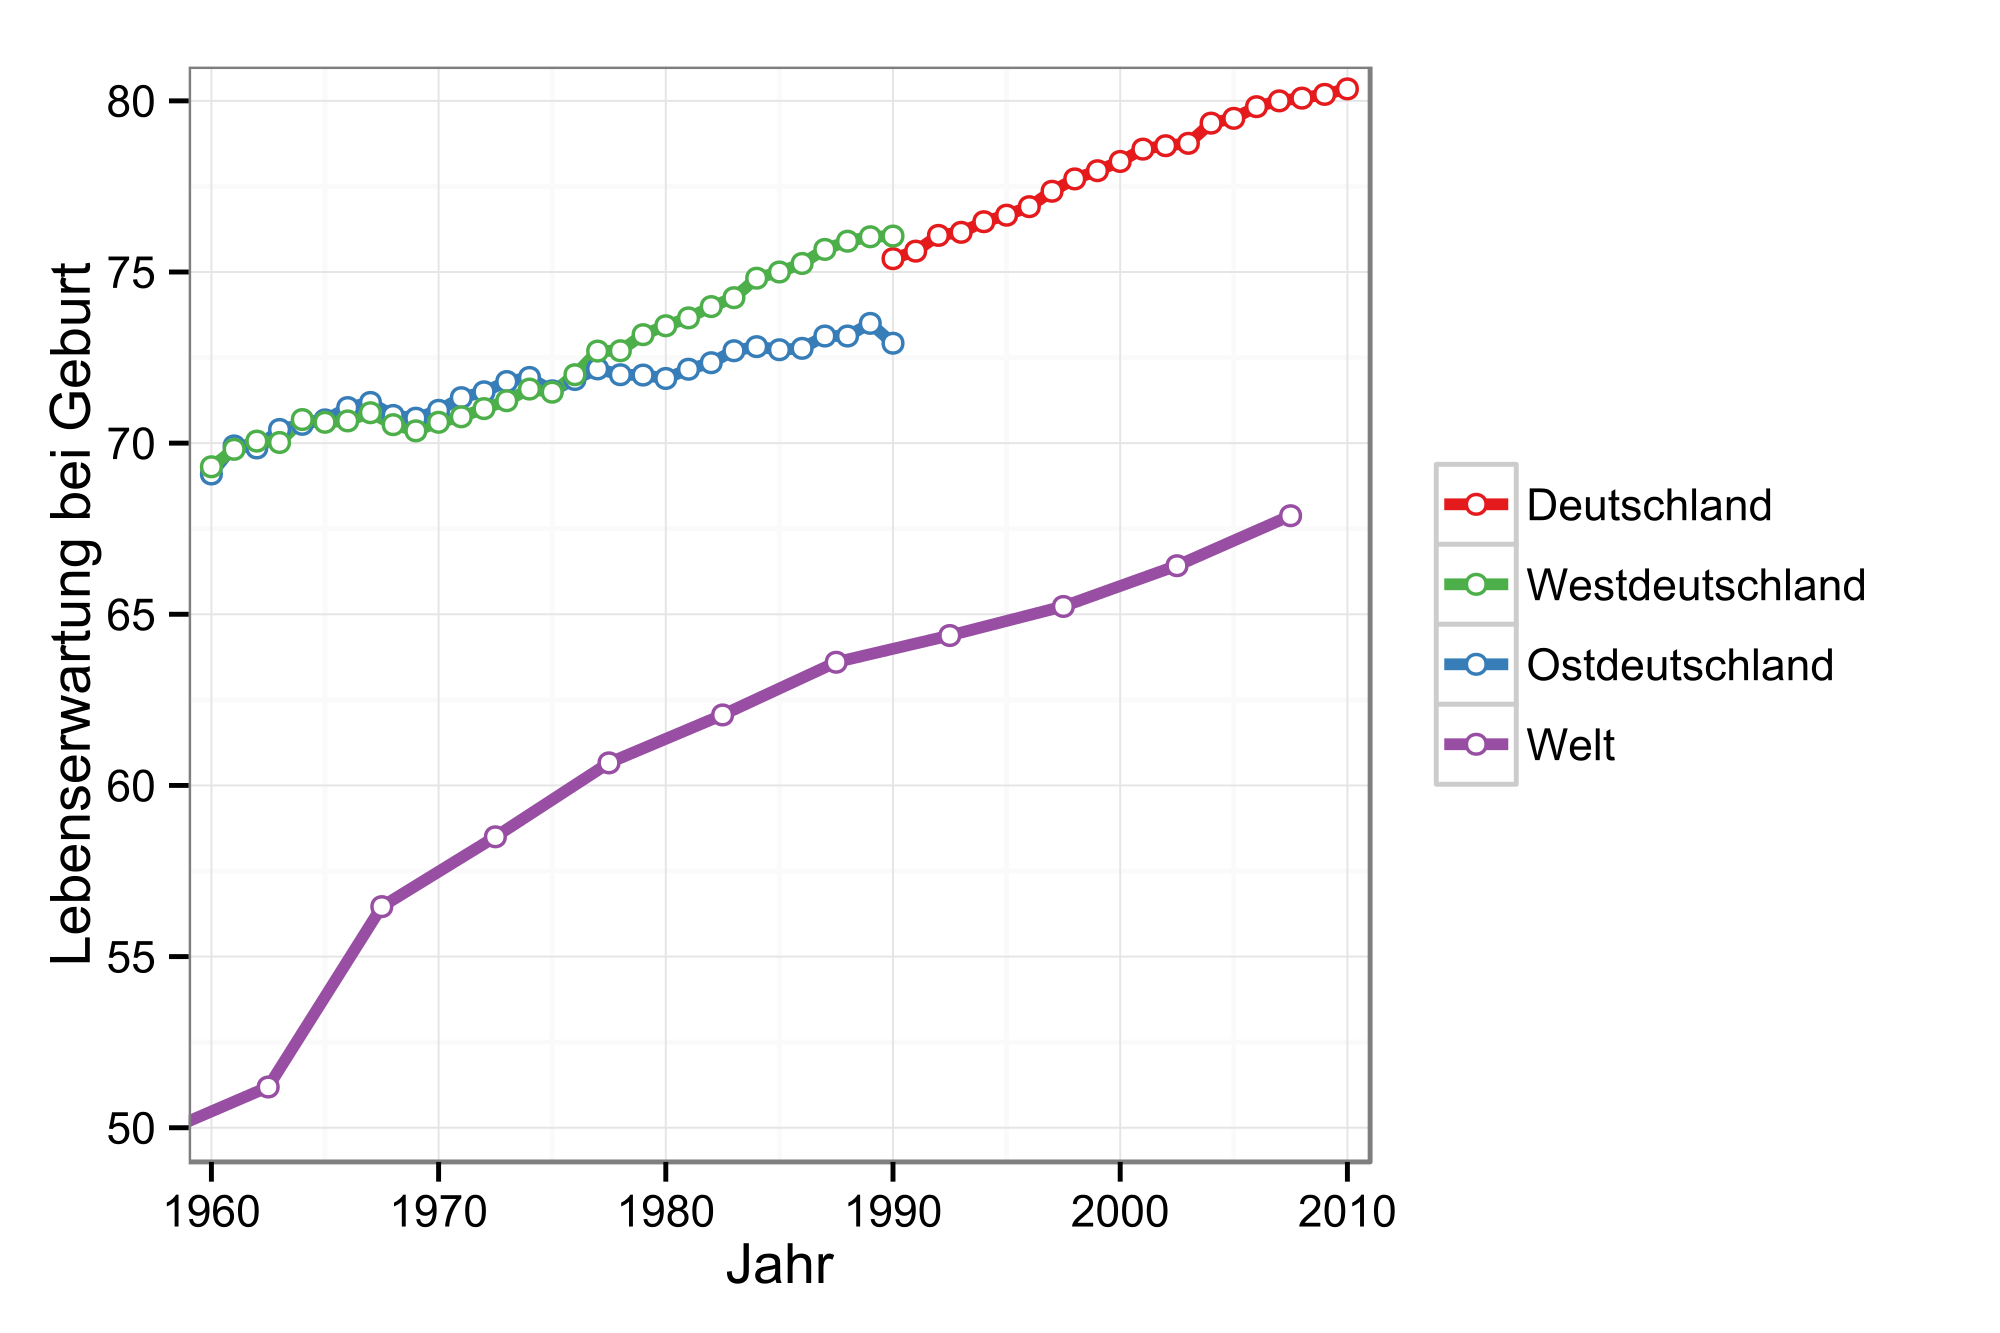
Lebenserwartung
Welt-Bruttoinlandsprodukt
Das Bruttoinlandsprodukt (BIP) misst den Wert der im Inland hergestellten Waren und Dienstleistungen (Wertschöpfung), soweit diese nicht als Vorleistungen für die Produktion anderer Waren und Dienstleistungen verwendet werden. Das BIP ist gegenwärtig das wichtigste gesamtwirtschaftliche Produktionsmaß. Das reale BIP ist unabhängig von Preisveränderungen, da es zu den Preisen eines Basisjahres, also in konstanten Preisen, berechnet wird.
Das Welt-Bruttoinlandsprodukt (BIP) ist weltweit sehr ungleich verteilt. Im Jahr 2014 entfiel allein auf die fünf Staaten mit dem höchsten BIP gut die Hälfte des gesamten Welt-BIP (50,8 Prozent). Und obwohl in Europa und Nordamerika 2014 lediglich 12,3 Prozent der Weltbevölkerung lebten, hatten die beiden Regionen einen Anteil von 50,4 Prozent am Welt-BIP. Auf der anderen Seite lag der Anteil Afrikas am Welt-BIP im selben Jahr bei lediglich 3,1 Prozent.
BIP,
aktuelle Preise, nicht inflationsbereinigt!
|
|
1970
|
1980
|
1990
|
2000
|
2005
|
2010
|
2014
1
|
|
BIP,
in Mrd. US-Dollar
|
|
|
Welt
|
3.402
|
12.283
|
22.900
|
33.256
|
47.203
|
65.430
|
77.451
|
|
Asien
|
448
|
1.992
|
4.850
|
8.245
|
10.337
|
17.263
|
22.034
|
|
Europa
|
932
|
4.082
|
7.905
|
9.264
|
15.049
|
17.980
|
19.737
|
|
Nordamerika
|
1.170
|
3.153
|
6.607
|
11.099
|
14.352
|
16.687
|
19.322
|
|
Südamerika
|
119
|
478
|
771
|
1.390
|
1.677
|
3.808
|
4.368
|
|
Naher
und Mittlerer Osten
|
59
|
502
|
605
|
953
|
1.632
|
2.805
|
3.518
|
|
Afrika
|
108
|
559
|
543
|
636
|
1.104
|
1.925
|
2.427
|
|
Ozeanien
|
54
|
204
|
381
|
478
|
900
|
1.467
|
1.719
|
|
Mittelamerika
und Karibik
|
62
|
300
|
388
|
815
|
1.095
|
1.386
|
1.710
|
|
|
|
|
|
USA
|
1.082
|
2.879
|
6.012
|
10.355
|
13.181
|
15.065
|
17.527
|
|
China
3
|
95
|
336
|
485
|
1.371
|
2.481
|
6.207
|
10.410
|
|
Japan
|
209
|
1.087
|
3.104
|
4.731
|
4.572
|
5.495
|
4.587
|
|
Deutschland
4
|
215
|
947
|
1.765
|
1.947
|
2.858
|
3.412
|
3.852
|
|
Vereinigtes
Königreich
|
130
|
563
|
1.060
|
1.549
|
2.412
|
2.408
|
2.950
|
|
Frankreich
|
149
|
705
|
1.278
|
1.371
|
2.208
|
2.652
|
2.849
|
|
Brasilien
|
35
|
191
|
402
|
645
|
882
|
2.143
|
2.200
|
|
Italien
|
113
|
476
|
1.178
|
1.142
|
1.853
|
2.127
|
2.157
|
|
Indien
|
61
|
185
|
327
|
468
|
837
|
1.705
|
2.041
|
|
Russland
|
-
|
-
|
-
|
260
|
764
|
1.525
|
1.865
|
|
Kanada
|
88
|
273
|
592
|
739
|
1.164
|
1.614
|
1.787
|
|
Australien
|
45
|
173
|
324
|
409
|
762
|
1.290
|
1.475
|
|
Südkorea
|
9
|
68
|
285
|
562
|
898
|
1.094
|
1.416
|
|
Spanien
|
42
|
237
|
546
|
595
|
1.157
|
1.432
|
1.404
|
|
Mexiko
|
44
|
232
|
293
|
649
|
865
|
1.050
|
1.279
|
|
Niederlande
|
38
|
192
|
313
|
413
|
672
|
836
|
865
|
|
Indonesien
5
|
10
|
80
|
126
|
165
|
286
|
709
|
848
|
|
Türkei
|
24
|
92
|
203
|
267
|
483
|
731
|
801
|
|
Saudi-Arabien
|
5
|
165
|
117
|
188
|
328
|
527
|
757
|
|
Schweiz
|
24
|
119
|
259
|
274
|
411
|
586
|
717
|
|
Schweden
|
38
|
140
|
258
|
260
|
389
|
488
|
569
|
|
Nigeria
|
25
|
204
|
68
|
75
|
181
|
369
|
566
|
|
Venezuela
|
14
|
69
|
47
|
117
|
146
|
394
|
562
|
|
Polen
|
28
|
58
|
65
|
172
|
304
|
477
|
547
|
|
Belgien
|
27
|
127
|
206
|
237
|
387
|
484
|
533
|
|
Argentinien
|
38
|
90
|
169
|
340
|
223
|
465
|
533
|
|
Taiwan
|
6
|
42
|
167
|
331
|
376
|
446
|
530
|
|
Norwegen
|
13
|
65
|
120
|
171
|
309
|
429
|
500
|
|
Österreich
|
15
|
82
|
166
|
196
|
315
|
390
|
436
|
|
Thailand
|
7
|
33
|
88
|
126
|
189
|
339
|
406
|
|
Vereinigte
Arabische Emirate
|
1
|
44
|
51
|
104
|
181
|
286
|
406
|
|
Iran
6
|
10
|
92
|
91
|
104
|
206
|
422
|
396
|
|
Kolumbien
|
10
|
47
|
57
|
100
|
147
|
287
|
384
|
|
Südafrika
|
18
|
83
|
116
|
136
|
258
|
375
|
350
|
|
Dänemark
|
17
|
71
|
138
|
164
|
265
|
320
|
342
|
|
Malaysia
|
4
|
26
|
48
|
98
|
144
|
248
|
326
|
|
Israel
|
6
|
25
|
60
|
129
|
139
|
232
|
305
|
|
Singapur
|
2
|
12
|
39
|
94
|
125
|
233
|
301
|
|
Philippinen
|
7
|
36
|
49
|
81
|
103
|
200
|
285
|
|
Ägypten
|
8
|
20
|
36
|
96
|
94
|
215
|
282
|
|
Finnland
|
11
|
54
|
142
|
126
|
204
|
248
|
270
|
|
Pakistan
|
13
|
31
|
52
|
77
|
118
|
175
|
259
|
|
Chile
|
10
|
30
|
34
|
77
|
123
|
218
|
258
|
|
Irland
|
4
|
22
|
49
|
99
|
210
|
218
|
246
|
|
Griechenland
|
13
|
57
|
98
|
132
|
248
|
300
|
238
|
|
Portugal
|
8
|
33
|
79
|
118
|
197
|
238
|
232
|
|
Algerien
|
5
|
42
|
62
|
55
|
103
|
161
|
212
|
|
Katar
|
1
|
8
|
7
|
18
|
45
|
125
|
209
|
|
Tschechische
Republik 7
|
16
|
48
|
57
|
61
|
136
|
207
|
205
|
|
Kasachstan
|
-
|
-
|
-
|
18
|
57
|
148
|
205
|
|
Neuseeland
|
7
|
23
|
45
|
54
|
115
|
145
|
202
|
|
Peru
|
6
|
16
|
28
|
51
|
76
|
147
|
201
|
|
Rumänien
|
13
|
36
|
41
|
37
|
100
|
168
|
200
|
|
Irak
|
2
|
13
|
17
|
17
|
36
|
117
|
191
|
|
Vietnam
|
3
|
2
|
6
|
31
|
53
|
116
|
187
|
|
Bangladesch
|
7
|
19
|
32
|
52
|
66
|
115
|
175
|
|
Kuwait
|
3
|
29
|
18
|
38
|
81
|
115
|
173
|
|
Ungarn
|
6
|
25
|
37
|
47
|
112
|
130
|
137
|
|
Ukraine
|
-
|
-
|
-
|
32
|
89
|
141
|
135
|
|
Angola
|
3
|
5
|
10
|
9
|
33
|
83
|
126
|
|
Marokko
|
4
|
21
|
29
|
37
|
60
|
91
|
109
|
|
Ecuador
|
2
|
14
|
13
|
18
|
42
|
70
|
101
|
1 Vorausberechnungen
2 GUS - Gemeinschaft unabhängiger Staaten / CIS - Commonwealth of
Independent States
3 einschließlich Hongkong und Macao
4 1970/1980: Westdeutschland
5 1970 bis 2000: einschl. Osttimor (ehem.)
6 die UNCTAD ordnet den Iran der Region Südasien zu, hier: Naher und
Mittlerer Osten
7 1970 bis 1990: Tschechoslowakei
Quelle:
United Nations Conference on Trade and Development (UNCTAD): Online-Datenbank:
UNCTADstat (Stand: August 2015)
Vergleich/Unterschied
"BIP
aktuelle Preise"
zu "BIP
real (inflationsbereinigt)"
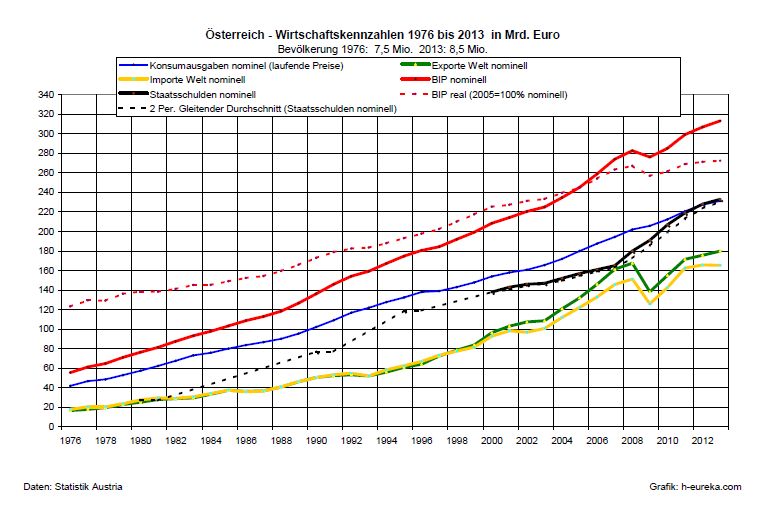
für Österreich für den Zeitraum 1970 bis 2014 (44 Jahre):
BIP
aktuelle Preise: Faktor 29
BIP
real: Faktor 2,8
BIP real zum
Vorjahr in Prozent Daten
2016/10
Prognosen EU-Kommission: http://ec.europa.eu/economy_finance/eu/forecasts
(Daten in Klammer: OECD-Konjunkturprognose 2016/17/18)
| 2010 |
2011 |
2012 |
2013 |
|
2014 |
2015 |
2016 |
2017 |
2018 |
2019 |
2020 |
|
1,5 |
-0,4 |
0,1 |
EU |
1,3 |
1,5 |
1,8 |
1,6 |
1,8 |
|
|
|
1,4 |
-0,7 |
-0,4 |
Eurozone |
0,8 |
1,1 |
1,7
(1,7) |
1,5
(1,6) |
1,7
(1,7) |
|
|
|
|
|
|
(OECD) |
|
|
(1,7) |
(2,0) |
(2,3) |
|
|
|
3,0 |
0,7 |
0,4 |
Deutschland |
1,3 |
1,1 |
1,9
(1,7) |
1,5
(1,7) |
1,7
(1,7) |
|
|
|
2,7 |
0,9 |
0,4 |
Österreich |
0,7 |
1,2 |
1,5
(1,5) |
1,6
(1,5) |
1,6
(1,3) |
|
|
|
|
0,0 |
0,2 |
Frankreich |
0,3 |
0,7 |
1,3 |
1,4 |
1,7 |
|
|
|
|
-2,4 |
-1,9 |
Italien |
-0,4 |
0,6 |
0,7 |
0,9 |
1,0 |
|
|
|
|
0,9 |
1,5 |
Schweden |
2,0 |
2,4 |
3,4 |
2,4 |
2,1 |
|
|
|
|
0,3 |
1,7 |
Großbritanien |
3,1 |
2,7 |
1,9
(2,0) |
1,0
(1,2) |
1,2
(1,0) |
|
|
|
|
|
|
|
|
|
|
|
|
|
|
|
|
-3,2 |
-1,4 |
Portugal |
0,3 |
1,3 |
0,9 |
1,2 |
1,4 |
|
|
|
-7,1 |
-7,0 |
-3,9 |
Griechenland |
0,6 |
2,9 |
-0,3
(0) |
2,7
(1,3) |
3,1
(1,9) |
|
|
|
0,4 |
-1,6 |
-1,2 |
Spanien |
1,2 |
1,7 |
3,2
(3,2) |
2,3
(2,3) |
2,1
(2,2) |
|
|
|
|
|
|
|
|
|
|
|
|
|
|
|
|
2,8 |
1,9 |
USA |
2,8 |
3,2 |
1,6
(1,5) |
2,1(2,3) |
1,9
(3,0) |
|
|
|
|
1,4 |
1,5 |
Japan |
1,5 |
1,3 |
0,7
(0,8) |
0,8
(1,0) |
0,4
(0,8) |
|
|
|
|
7,7 |
7,7 |
China |
7,2 |
7,0 |
6,6
(6,7) |
6,2
(6,4) |
6,0
(6,1) |
|
|
|
|
|
|
Indien |
|
|
(7,4) |
(7,6) |
(7,7) |
|
|
|
|
|
|
Brasilien |
|
|
(-3,4) |
(0,0) |
(1,2) |
|
|
>>>
Happy Planet Index (HPI) vs. BIP pro Kopf (KKP)
Wirtschaftswachstum,
IWF-Prognose, Jänner2017
|
|
2015 |
2016 |
2017 |
2018 |
2019 |
2020 |
| Indien |
|
6,6 |
7,2 |
7,7 |
|
|
| China |
|
6,7 |
6,5 |
6,0 |
|
|
| Welt |
|
3,1 |
3,4 |
3,6 |
|
|
| Nahost/Nordafrika |
|
3,8 |
3,1 |
3,5 |
|
|
| Afrika,
südl. der Sahara |
|
1,6 |
2,8 |
3,7 |
|
|
| USA |
|
1,6 |
2,3 |
2,5 |
|
|
| Eurozone |
|
1,7 |
1,6 |
1,6 |
|
|
| Deutschland |
|
1,7 |
1,5 |
1,5 |
|
|
| Großbritannien |
|
2,0 |
1,5 |
1,4 |
|
|
| Russland |
|
-
0,6 |
1,1 |
1,2 |
|
|
| Japan |
|
0.9 |
0,8 |
0,5 |
|
|
| Brasilien |
|
-
3,5 |
0,2 |
1,5 |
|
|
| Lateinamerika
/ Karibik |
|
-0,7 |
1,2 |
2,1 |
|
|
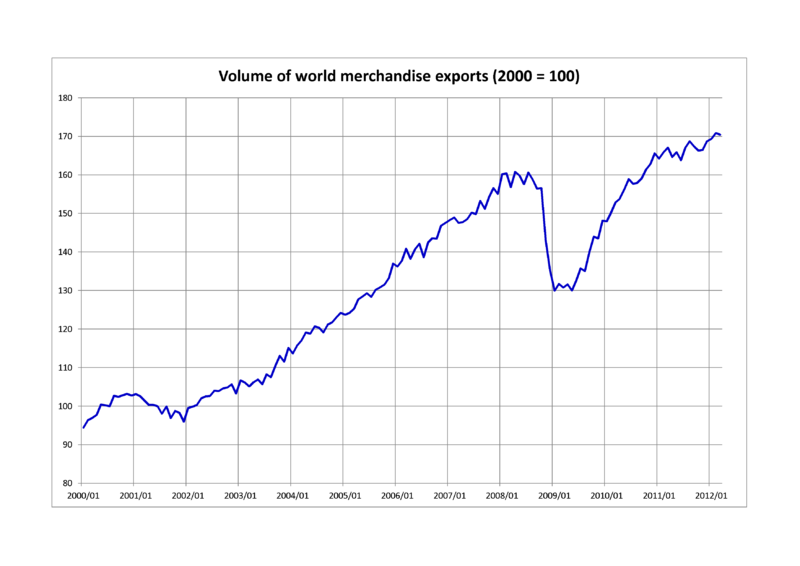
Welthandel
Reale Entwicklung der
weltweiten Waren-Exporte 2000–2012
Arbeitslosigkeit
Quelle: EU-Kommission
2016/10
| in % |
2010 |
2011 |
2012 |
2013 |
2014 |
2015 |
2016 |
2017 |
2018 |
2019 |
2020 |
| EU |
|
9,8 |
10,4 |
10,8 |
10,5 |
10,0 |
8,6 |
8,3 |
7,9 |
|
|
| Eurozone |
|
10,2 |
11,3 |
12,0 |
11,8 |
11,3 |
10,1 |
9,7 |
9,2 |
|
|
| Deutschland |
|
5,5 |
5,5 |
5,3 |
5,1 |
5,1 |
4,4 |
4,3 |
4,2 |
|
|
| Österreich |
|
4,0 |
4,3 |
4,9 |
4,8 |
4,7 |
5,9 |
6,1 |
6,1 |
|
|
| Frankreich |
|
9,8 |
9,8 |
10,3 |
10,4 |
10,2 |
10,0 |
9,9 |
9,6 |
|
|
| Italien |
|
8,6 |
10,7 |
12,2 |
12,8 |
12,5 |
11,5 |
11,4 |
11,3 |
|
|
| Spanien |
|
22,9 |
25,0 |
26,4 |
25,5 |
24,0 |
19,7 |
18,0 |
16,5 |
|
|
| Griechenland |
|
18,8 |
23,4 |
27,3 |
26,0 |
24,0 |
23,5 |
22,2 |
20,3 |
|
|
| Portugal |
|
13,2 |
15,9 |
16,5 |
15,4 |
14,8 |
11,1 |
10,0 |
9,5 |
|
|
Jugendarbeitslosigkeit
Quelle: EU-Kommission
| in % |
2010 |
2011 |
2012 |
2013 |
2014 |
2015 |
2016 |
2017 |
2018 |
2019 |
2020 |
| EU |
21,0 |
21,4 |
22,9 |
23,3 |
|
|
18,2 |
|
|
|
|
| Eurozone |
20,7 |
20,7 |
23,0 |
23,7 |
|
|
20,3 |
|
|
|
|
| Deutschland |
9,9 |
8,6 |
8,1 |
7,9 |
|
|
6,8 |
|
|
|
|
| Österreich |
8,8 |
8,3 |
8,7 |
9,2 |
|
|
11,7 |
|
|
|
|
| Frankreich |
22,9 |
22,1 |
23,9 |
23,9 |
|
|
23,9 |
|
|
|
|
| Italien |
27,8 |
29,1 |
35,3 |
40,0 |
|
|
37,1 |
|
|
|
|
| Spanien |
41,6 |
46,4 |
53,2 |
55,7 |
|
|
42,6 |
|
|
|
|
| Griechenland |
32,9 |
44,4 |
55,3 |
58,3 |
|
|
42,7 |
|
|
|
|
| Portugal |
22,4 |
30,1 |
37,7 |
37,7 |
|
|
26,5 |
|
|
|
|
Die
Jugendarbeitslosenquote drückt die Zahl der arbeitslosen 15-24-Jährigen als
Anteil der Erwerbspersonen der gleichen Altersklasse aus.
Steuerquoten
in % BIP, OECD
|
Irland |
Rumänien |
Tschechien |
Großbritannien |
Deutschland |
EU-28 |
Italien |
Schweden |
Österreich |
Dänemark |
Frankreich |
| % |
24,4 |
28,0 |
34,4 |
34,9 |
40,0 |
40,0 |
43,5 |
44,2 |
44,4 |
47,6 |
47,9 |
Finanztransaktionen,
Handel mit Wertpapieren
2014
umfasste der weltweite Finanzmarkt die Summe von 294
Billionen Dollar. (Quelle:
Deutsche Bank).
Die
weltweite Wirtschaftsleistung lag bei 76
Billionen US-Dollar. Damit ist der Markt der globalen Assets fast viermal so groß
wie das Welt-BIP.
Der
Aktienmarkt umfasst dabei derzeit rund 69 Billionen Dollar (= 23,5%). Der Rest
besteht aus festverzinslichen Wertpapieren aller Art.
Die
Schulden dieser Welt
Ob
private Haushalte, Unternehmen oder Regierungen, ob in
Europa, Asien oder Amerika, ob in Industrie- oder Entwicklungsländern - die
Welt versinkt in Schulden.
Wie
rapide die Entwicklung in den vergangenen Jahren verlaufen ist, wird an der
Summe aller Schulden dieser Welt deutlich: Im Jahr 2000 addierten sie sich zu 87
Billionen Dollar, 2007 betrugen sie bereits 142 Billionen Dollar - um bis zum
zweiten Quartal 2014 auf nun 199 Billionen Dollar empor zu schnellen.
Betrugen
im Jahr 2007 die Schulden noch 269 Prozent der jährlichen
Wirtschaftsleistung,
ist das Verhältnis nun auf 286 Prozent gestiegen, so die internationalen
Experten des Forschungszweigs von McKinsey in ihrem Report.
Diese
Untersuchung betrachtet nicht nur die Schulden des Staates, sondern auch die der
Unternehmen und Privathaushalte. Diese Gesamtsicht ermöglicht einen
realistischen Blick auf die Lage eines Landes.
Niedrige
Staatsschulden nützen wenig, wenn Haushalte oder Unternehmen kurz vor dem
finanziellen Kollaps stehen. Und umgekehrt kann ein Land auch mit hohen
Staatsschulden klarkommen, wenn die Bürger fleißig sparen und ihr Geld
unverdrossen in Anleihen ihres Heimatlandes stecken.
Quelle:
Haver Analytics; national sources; World economic outlook, IMF; BIS; McKinsey
Global Institut
Mehr
zum Thema >>> Geld und Schulden
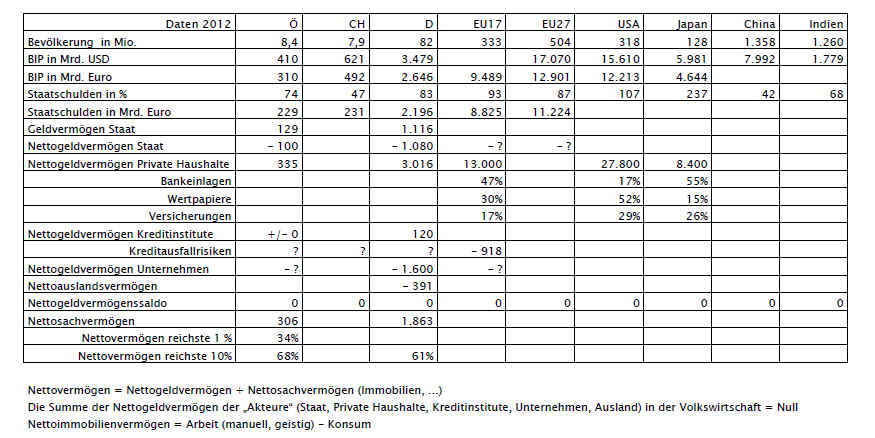
Schulden
und Guthaben (Geldvermögen)
...
Die
Summe der Guthaben (+ der Zinsen) ist gleich der Summe der Schulden ...
Wirtschaftskennzahlen Österreich
BIP
pro Kopf - Index 2005 = 100
Lebenszufriedenheit
Österreich
Important
indicators national economy / Wichtige Kenngrößen der Makroökonomie
Total population
/ Bevölkerungszahl
Population
growth rates / Bevölkerungswachstum
Age
distribution / Altersstruktur
Total fertility
rates / Fruchtbarkeitsrate (Anzahl Kinder pro Frau)
Suicide rates /
Selbstmordraten
Household
disposable income / Verfügbares Haushaltseinkommen
Net
assets private households in % of GDP / Nottogeldvermögen privater Haushalte
Dept
private households in % of GDP / Schulden privater Haushalte in % BIP
Dept
private sector (private households, companies, financial institutes) in % of GDP
/ Schulden privater Sektor (Haushalte, Unternehmen, Finanzinstitute)
Unemployment
rate / Arbeitslosenrate
Unemployment
rate young people (< 21 years) / Jugendarbeitslosenrate
Inflation
rate / Inflationsrate
GINI –
Koeffizient für die Ungleichverteilung des Einkommens
Exports
of goods and services
Imports
of goods and services / Einfuhr von Gütern und Dienstleistungen
Current
account balance of payments / Leistungsbilanz
GDP gross
domestic product / BIP Bruttoinlandsprodukt
GDP per capita /
BIP pro Kopf
Real GDP growth
/ reales Wirtschaftswachstum
Goverment
revenues / Staatseinnahmen
Taxes of average
worker in % of labour costs/ Steuern pro Arbeitskraft in % der Lohnkosten
Goverment
expenditures / Staatsausgaben
Goverment
deficit / Staatsdefizit
Goverment dept
(extern, intern) / Staatsschulden (Ausland / Inland)
Interest rates on government debt
/ Zinsen für
Staatsschulden
Links:
UNO
(United
Nations Organization), Vereinte Nationen (United Nations, UN)
http://www.un.org
UN
Flüchtlingshilfswerk http://www.unhcr.at/service/zahlen-und-statistiken.html
UN
World Food Programme
http://de.wfp.org/hunger/hunger-statistik
Europäische
Union http://europa.eu
Eurostat
http://epp.eurostat.ec.europa.eu/portal/page/portal/eurostat/home/
OECD
http://www.oecd.org/
Internationaler
Währungsfond (IWF)
International Monetary Fund (IMF) http://www.imf.org
Weltbank
(World Bank Group) http://www.worlsbank.org
Weltklimarat (IPCC - Intergovernmental Panel on Climate Change)
http://www.ipcc.ch
Europäische
Zentralbank (EZB) http://www.ecb.int/ecb/html/index.de.html
Deutsche
Bundesbank
http://www.bundesbank.de
Österreichische
Nationalbank
http://www.oenb.at
Schweizerische
Nationalbank http://www.snb.ch/de
Statistik
Austria http://statistik.at
Statistisches
Bundesamt (Destatis) https://www.destatis.de
Statistik
Schweiz http://www.bfs.admin.ch
Wohlstands-Index
http://www.prosperity.com
Slow
food International
http://www.slowfood.com
Terra
Madre Weltweit
http://www.terramadre.info
Attac
International
http://www.attac.org/
Bücher
über Wirtschaft, Politik und Gesellschaft - über Qualität, Ethik und
Moral